 BiMr - Bird Migration Tool
Abstract
Considering the tweets provided by the Twitter users and the data feed provided by the eBird API, our application will be able to generate an interactive map in real-time, representing the current tendency of birds to move from one place to another. In that way we can visualize if there is a massive migration flow.
Motivation
The idea of this project came from the fact that there are few accessible applications that allow users to see detailed information about the birds migration around the entire world. This kind of instrument can be useful in many fields, especially in ornithology, although everyone without any professional background on this field can draw conclusions after seeing a real-time updated map that illustrates this phenomena.
Twitter is an online news and social networking application where users post and read 140-character messages called "tweets". Besides the content of the tweet, users may also make available the location, so people will know where the author was located when he posted the tweet.
eBird API 1.1 is a public API created by Cornell University, a private and statutory Ivy League research university located in Ithaca, New York. For our particular application, it provides a real-time updated data feed concerning bird migration phenomena. For example, it can offer show pieces of information such as hotspot sightings summaries, recent notable observations at hotspots, locations, regions or of a certain species. Moreover, along with these categories of information, each one offers data about the name of sighted species (both common naming and scientific), geographical coordinates, the name of the person that made the observation etc.
Our challenge is to build a technology to collect, process and display data, all in real time. All data managed by the developed Web application must be described in RDF – based on existing knowledge models. In this way, we will be able to visualize the migration of birds in a user friendly and intuitive manner using a web interface updated in real time.Technologies
The main technologies we'll use in this project are :
-
Back-end
- Java - a general-purpose computer programming language that is concurrent, class-based, object-oriented and specifically designed to have as few implementation dependencies as possible.
- WildFly , formerly known as JBoss AS, or simply JBoss, is an application server authored by JBoss, now developed by Red Hat. WildFly is written in Java, and implements the Java Platform, Enterprise Edition (Java EE) specification. It can runs on multiple platforms.
- The Google Maps Geolocation API - converts human fiendly location information (address) to GPS coordinates.
- eBird API, the public API created by Cornell University, that provides real-time data feed about migratory birds.
- RDF is a standard model for data interchange on the Web. RDF has features that facilitate data merging even if the underlying schemas differ, and it specifically supports the evolution of schemas over time without requiring all the data consumers to be changed.
- Enterprise JavaBeans (EJB) is one of several Java APIs for modular construction of enterprise software. EJB is a server-side software component that encapsulates business logic of an application. The EJB specification is a subset of the Java EE specification.
- Hibernate ORM, an object-relational mapping tool for the Java programming language. It provides a framework for mapping an object-oriented domain model to a relational database.
- Stanford NLP is a team of faculty, postdocs, programmers and students who work together on algorithms that allow computers to process and understand human languages, by covering areas such as sentence understanding, automatic question answering, machine translation, syntactic parsing and tagging, sentiment analysis, and models of text and visual scenes, as well as applications of natural language processing to the digital humanities and computational social sciences.
- Apache Jena is an open source Semantic Web framework for Java. It provides an API to extract data from and write to RDF graphs. The graphs are represented as an abstract "model". A model can be sourced with data from files, databases, URLs or a combination of these. A Model can also be queried through SPARQL
- Apache Jena Fuseki is a SPARQL server. It can run as a operating system service, as a Java web application (WAR file), and as a standalone server. It provides security (using Apache Shiro) and has a user interface for server monitoring and administration. It provides the SPARQL 1.1 protocols for query and update as well as the SPARQL Graph Store protocol. Fuseki is tightly integrated with TDB to provide a robust, transactional persistent storage layer, and incorporates Jena text query and Jena spatial query. It can be used to provide the protocol engine for other RDF query and storage systems.
- Apache JMeter™ is a open source software, a 100% pure Java application designed to load test functional behavior and measure performance. It was originally designed for testing Web Applications but has since expanded to other test functions. Apache JMeter may be used to test performance both on static and dynamic resources, Web dynamic applications. It can be used to simulate a heavy load on a server, group of servers, network or object to test its strength or to analyze overall performance under different load types.
-
Front-end
- JavaScript - a full-fledged dynamic programming language that, when applied to an HTML document, can provide dynamic interactivity on websites.
- HTML5 - the latest evolution of the standard that defines HTML.
- CSS - a simple mechanism for adding style (e.g., fonts, colors, spacing) to Web documents.
- JavaServer Faces (JSF) is a Java specification for building component-based user interfaces for web applications and was formalized as a standard through the Java Community Process being part of the Java Platform, Enterprise Edition. It is also a MVC web framework that simplifies construction of user interfaces (UI) for server-based applications by using reusable UI components in a page.
- PrimeFaces, an open source user interface (UI) component library for JavaServer Faces (JSF) based applications, created by PrimeTek,Turkey.
Our proposal
Our proposal is meant to offer a scalable solution of obtaining and analysing tweets in real time and data feed from eBird API, concerning the aforementioned topic.
For this, we will develope our application by adapting the following code architecture:
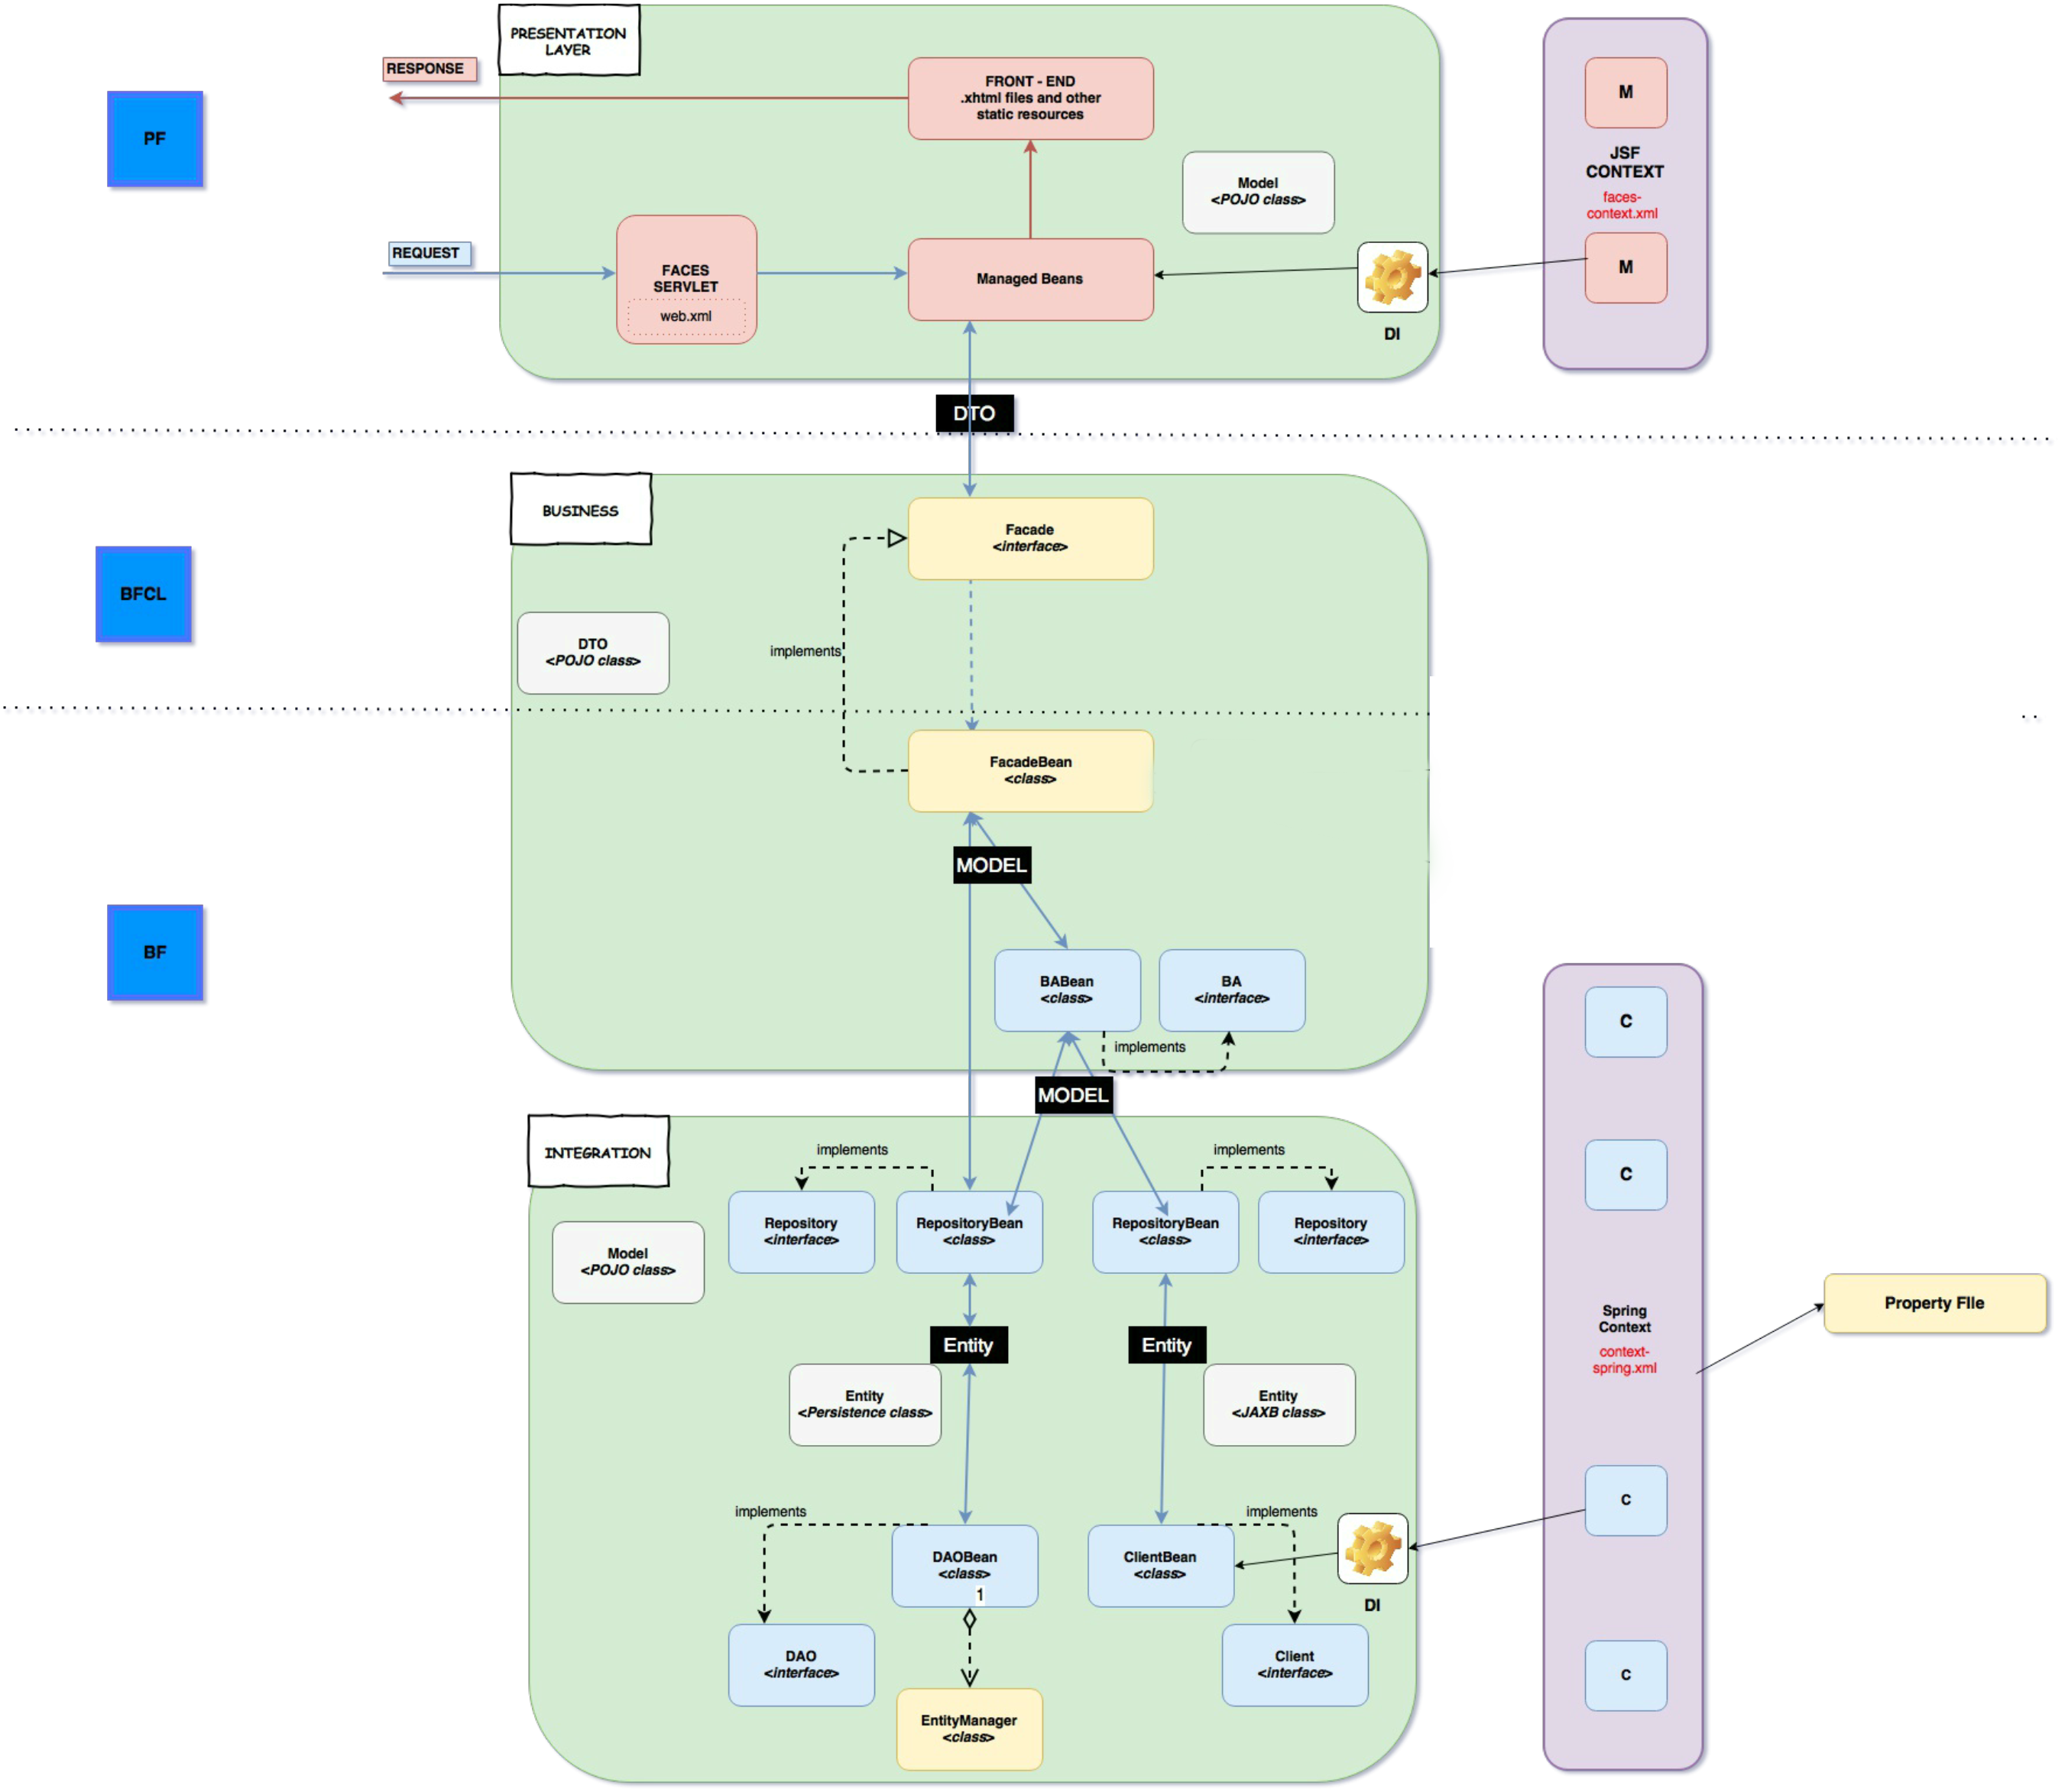
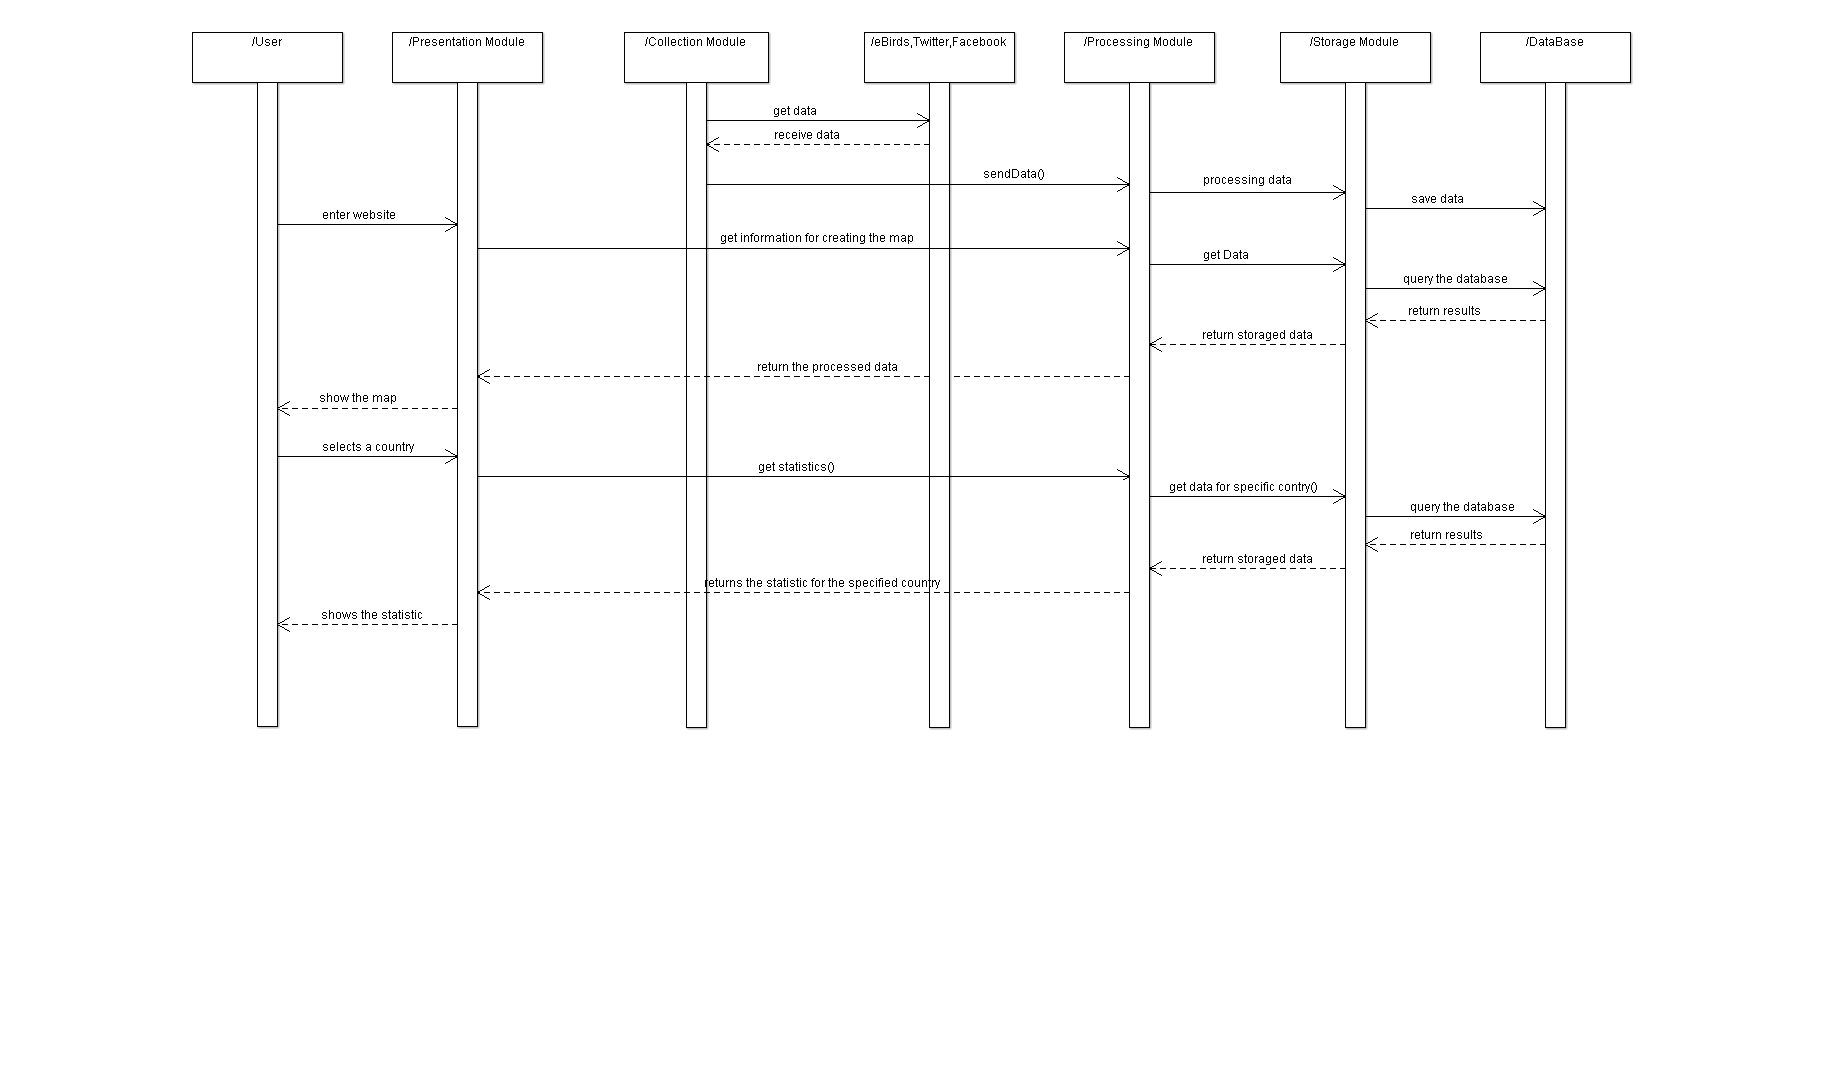
Architecture (Modules)
After studying the architecture shown above, we have come up with the following four main components of our application:

Data collector
First of all we need to have a contiously stream of data provided by Twitter and eBirds.
A module which collects data from Twitter Public Streaming API and the eBird will be implemented. For the twitter data we will be using twitter4j, Java library to get tweets from Twitter.
Twitter credentials are required for twitter4j to be able to pull tweets. We get these credentials by creating a new app
on twitter. By all means, this does not require the user to provide his actual credentials but for each created application, Twitter provides secrets to serve in
authenticating via OAuth.
A Job Scheduler will make calls every 24 hours to the eBird API and will collect all the new data. eBird API api does not require any kind of authentification or key and can be use at anytime.
For Twitter the Job Scheduler will make calls at every 15 minutes (it is a constraint from Twitter).

Data processing
Now that we have a continously fresh stream of data we can filter and process tweets. We keep only tweets which have the right hasttag (eg: #birdMigration, #birds, #birdsmig, etc) and come with a place or a specified location. Nowadays the users deactivate their localisation service of their phones and the tweets that have the location included are very few. Also, the tweet must to include the common name or the scientific name of the birds species. To filter the tweets that meets this criterias we will analyse each tweet's content using Stanford NLP TokensRegex framework, defining different patterns over text, patterns which match with the description of a location/bird. In the case of data provided by the eBird API the things are way simpler because the API provides all information needed by our application.
In order to find out if a simple word represents a name for a bird species or any other interesting entity (like person, link, location, author, etc.) we manually trained a model. These data represents the classifier in action. Obviously, some assumptions are wrong, because we need a lot more (manually) annotated tweets to obtain good results. From our calculations, we can obtain 65% rate of success with this classifier.
Data Persistance
All of the collected data is filtered in respect to the necessities of our application and the results are stored in RDFa format. The same model of data is used for both the information coming from Twitter and the information coming from eBird API.
Internal Data Models
The Tweet is the essential entity in our application, therefore the comunication between modules implies sending and receiving information about tweets and their owners. All the stored data will be in the RDF/XML format, aiming to model the necessary information about a tweet.
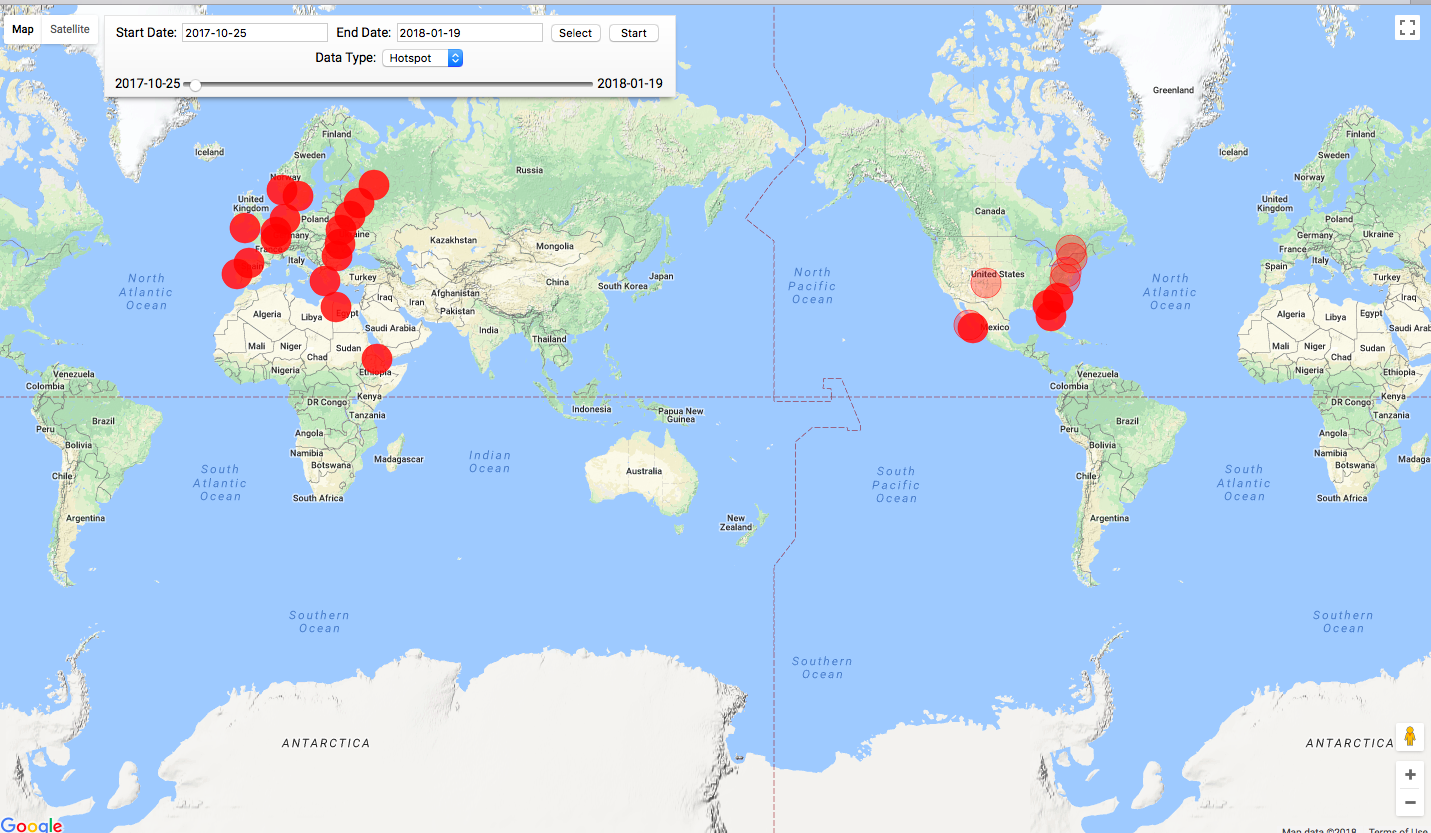
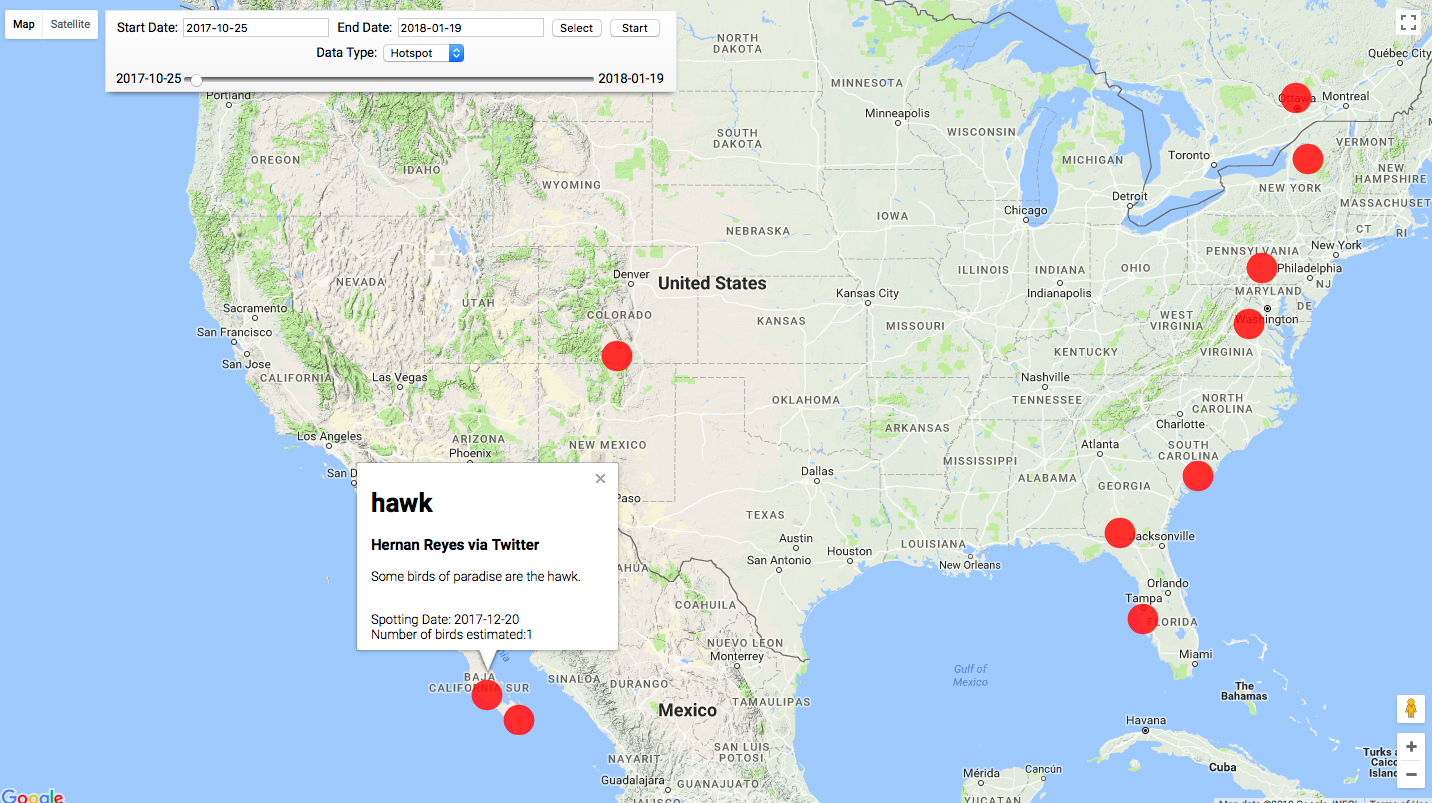
Data visualization
All of the data which have been collected and processed will be renderend on a world map with the help of Google Maps API. The vizualization of migration of the birds will be shown in timeframes, for every day the application will display the location where the birds we're spoted, and as such over the course of several weeks, the application will be able to show the birds migration in an animated manner. The website will also display information about the birds that we're spotted, like the species, number of birds that we're spotted in a location and a small description of the species with picture. The flocks of birds will be clusterized by region. When the user will zoom in, the bigger cluster will be divided in multiple smaller clusters.
Also, as a part of the visualization module, we are going to create some statistics over time, after collecting amounts of data. These statistics will show various information like what species migrates from one area to another, what species are the most present in a region, what are the prefered migration routes of certain species each year, how much time they spend in one place (amount of months, for example) etc.
Up above is an example of geoJSON, a format for encoding a variety of geographic data structures. We use it to pinpoint bird hotspots on the map so we can further illustrate the migration phenomena.
Open API
The application will provide an REST API which can be used to access the data collected by the aplication. The API will define a set of functions which will offer information about the data, from where has been collected, statistics about the data and the data itself. Developers can perform requests and receive responses via HTTP protocol such as GET and POST. The responses will be in JSON format.
All the endpoints of the API will require GET methods to be accessed. Some example of these endpoints:
- /tweets
- /ws/bimr/getAllTweets – returns all the tweets stored by the application;
- /data
- /ws/bimr/getAllMigrations – returns the data collected by the application in the last seven days;
- /ws/bimr/getMigrationsByDate{startDate}/{endDate}– returns all the data collected by the application at the specified location and in the range specified (km) ;
- /stats
- /ws/bimr/getMostObservedSpecies - returns a list with all species ordered by the number of their appeareance in tweets
The representation of migration object coming from the Open API:
            {
              "features": [
                  {
                      "geometry": {
                          "coordinates": [
                              7.17,
                              58.68
                          ],
                          "type": "Point"
                      },
                      "type": "Feature",
                      "properties": {
                          "migrationId": "c557c9b3-3edf-493d-94ec-b2ad278cf8c5",
                          "toHotspot": {
                              "observationDate": {
                                  "year": 2018,
                                  "month": "JANUARY",
                                  "dayOfMonth": 5,
                                  "dayOfWeek": "FRIDAY",
                                  "dayOfYear": 5,
                                  "monthValue": 1,
                                  "nano": 123000000,
                                  "hour": 9,
                                  "minute": 30,
                                  "second": 10,
                                  "chronology": {
                                      "id": "ISO",
                                      "calendarType": "iso8601"
                                  }
                              },
                              "hotspotId": "4b9c5017-b016-44d0-9677-b71190a826d5",
                              "geometry": {
                                  "coordinates": [
                                      12.81,
                                      57.52
                                  ],
                                  "type": "Point"
                              },
                              "birdSpeciesList": [
                                  "Eagle"
                              ]
                          },
                          "species": "Eagle",
                          "toHotspotId": "4b9c5017-b016-44d0-9677-b71190a826d5",
                          "fromHotspot": {
                              "observationDate": {
                                  "year": 2018,
                                  "month": "JANUARY",
                                  "dayOfMonth": 3,
                                  "dayOfWeek": "WEDNESDAY",
                                  "dayOfYear": 3,
                                  "monthValue": 1,
                                  "nano": 123000000,
                                  "hour": 9,
                                  "minute": 30,
                                  "second": 10,
                                  "chronology": {
                                      "id": "ISO",
                                      "calendarType": "iso8601"
                                  }
                              },
                              "hotspotId": "356f4742-907d-4ae1-a02c-c1df2f5ddd09",
                              "geometry": {
                                  "coordinates": [
                                      7.17,
                                      58.68
                                  ],
                                  "type": "Point"
                              },
                              "birdSpeciesList": [
                                  "Eagle"
                              ]
                          },
                          "fromHotpsotId": "356f4742-907d-4ae1-a02c-c1df2f5ddd09"
                      }
                  }
                }
Results for non-functional testing (stress testing)
Apache JMeter™
The Apache JMeter™ application is open source software, a 100% pure Java application designed to load test
functional behavior and measure performance. It was originally designed for testing Web Applications but has
since expanded to other test functions.
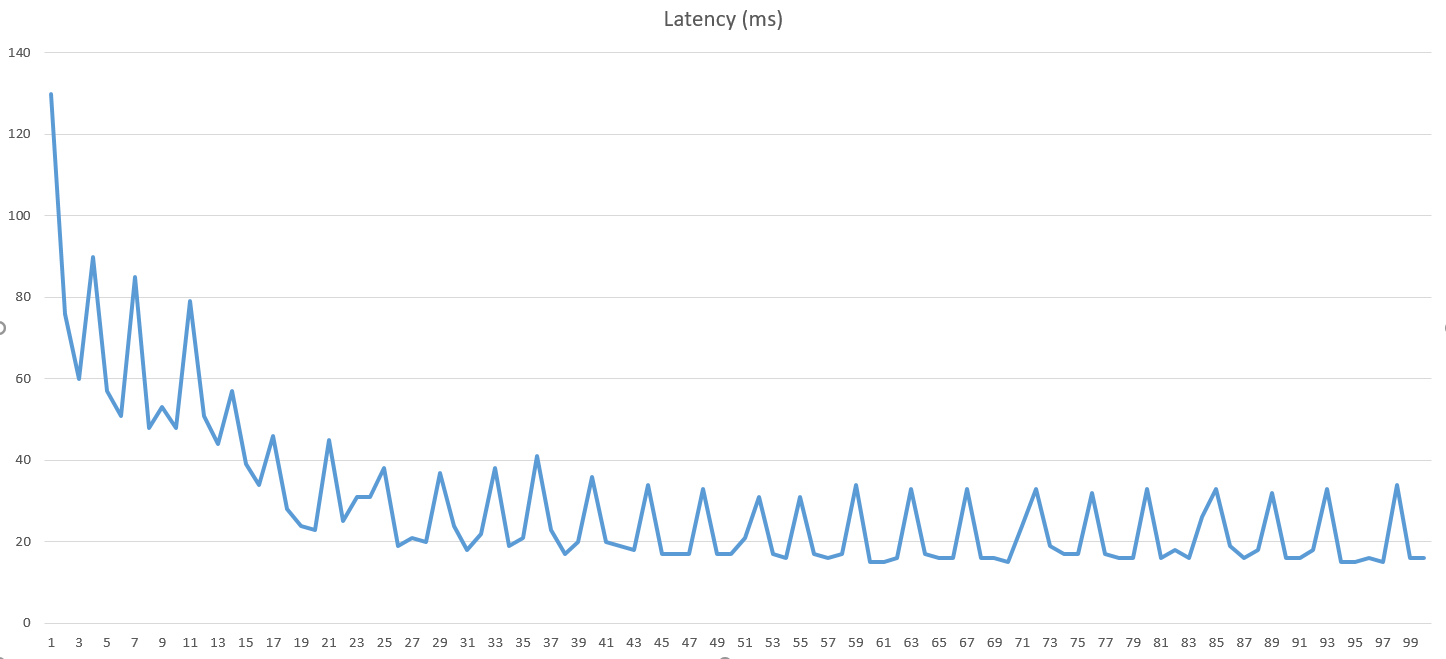
We can easily observe that handling 100 users requesting access to our application doesn't take too much.
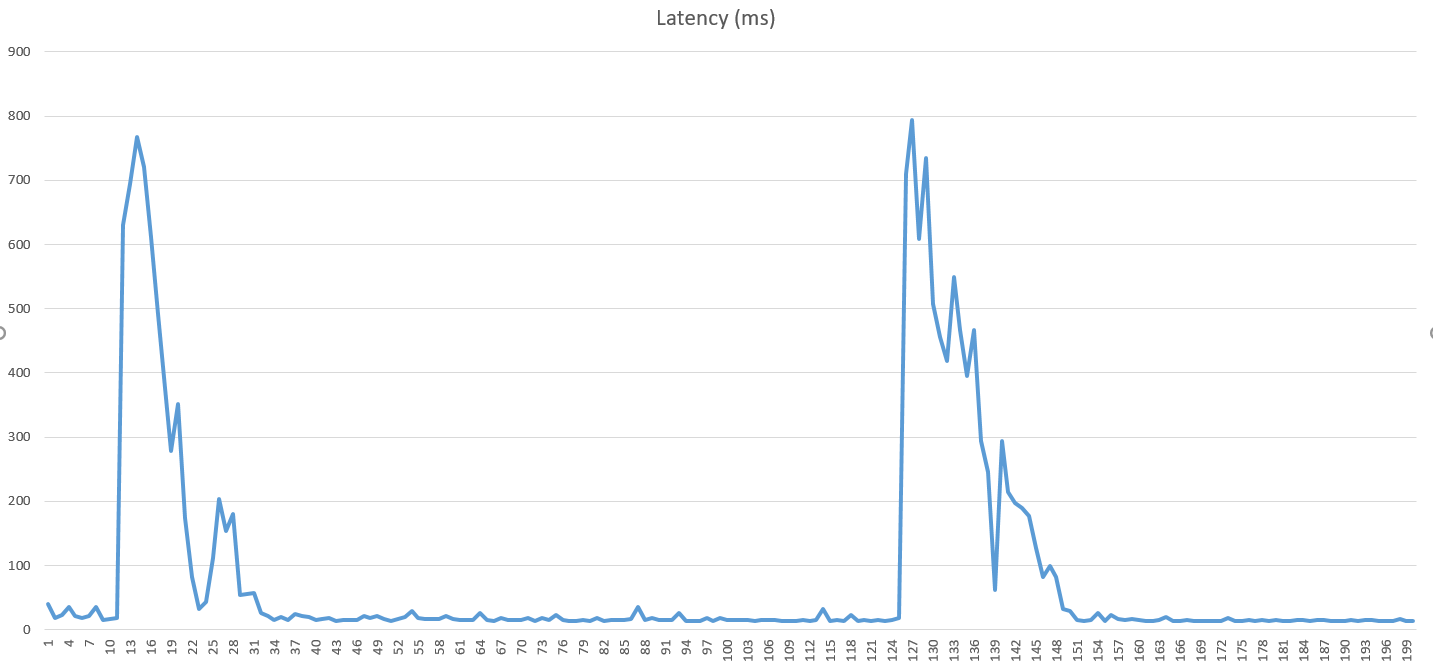
Almost the same goes for the case where BiMr server has to cope with 200 requests at once from 200 users. There are some increase spikes in latency however, especially when our application makes use of the scheduled caller to the Twitter API.
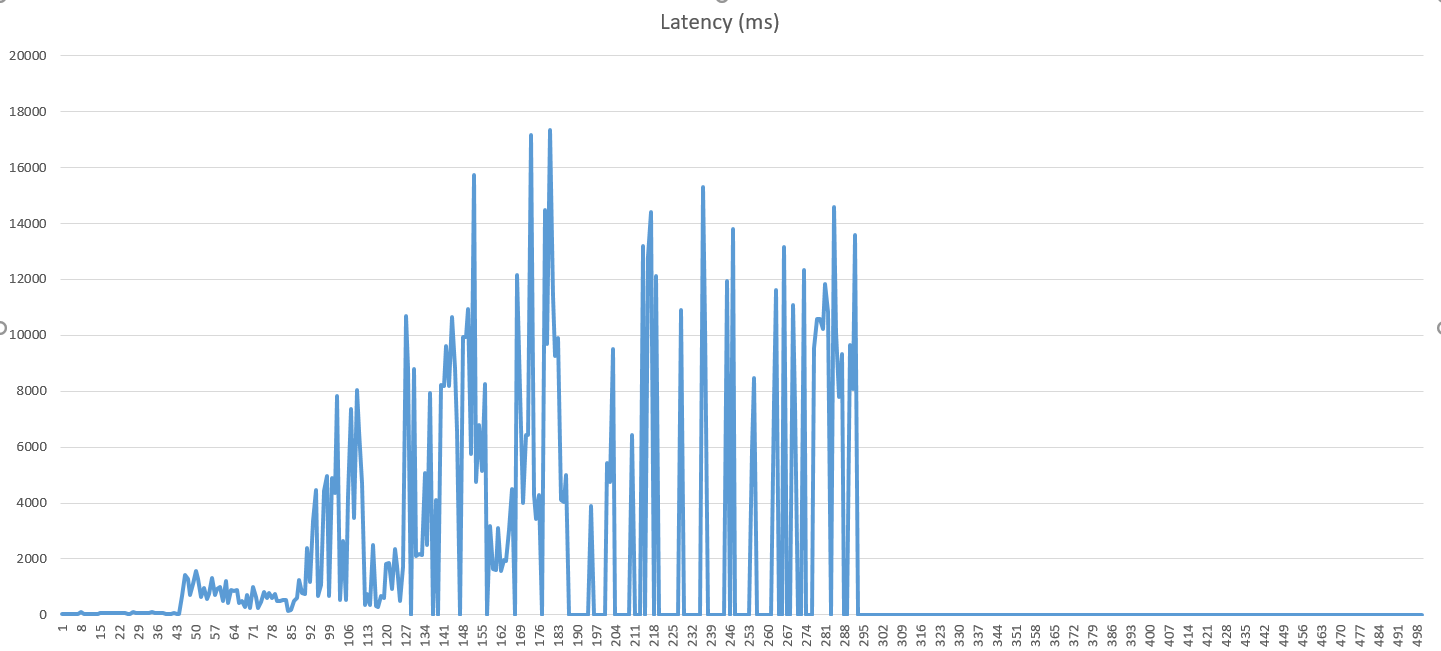
When it comes to handling 500 users at the same time, the application server can handle about one hundred requests before starting to lag (latency spikes to be observed). Moreover, after about 300 requests, the server enters a freeze state where it cannot handle the remaining requests in the waiting queue.
We can easily see that the application could handle a relatively small but important number of users in its incipient phases and could really have improvements on how it can handle the requests more efficiently in the future versions.
External data sources
Twitter Public Streaming API
The following streams offer samples of the public data flowing through Twitter.
Once applications establish a connection to a streaming endpoint, they are delivered a feed of Tweets,
without needing to worry about polling or exceeding REST API quotas.
Twitter4J
Is an open source Java library used to integrate our application with Twitter services.
Used for retrieving information about a place mentioned in a tweet, such as latitude and longitude.
{
    "formatted_address": "Iasi, Romania",
    "geometry": {
        "bounds": {
            "northeast": {
                "lat": 47.2274375,
                "lng": 27.6969839
            },
            "southwest": {
                "lat": 47.0848370999999,
                "lng": 27.4769569
            }
        },
        "location": {
            "lat": 47.1584549,
            "lng": 27.6014418
        },
        "location_type": "APPROXIMATE",
        "viewport": {
            "northeast": {
                "lat": 47.2274375,
                "lng": 27.6969839
            }
        }
    }
}
Conclusion
The application will provide a real-time migration map of different species of birds across the globe with the help of live data in the form of tweets from twitter and also from stable data coming from the eBird API for people who love birds or who have a hooby in spotting birds or those of whom just have curiosity about the birds migration.
References
- Twitter - social media for tweets concerning the bird migration
- eBird API - public data feed specific for our project's needs
- Twitter4J - tool for grabbing tweets
- WildFly - application server
- The Google Maps Geolocation API - converts human fiendly location information (address) to GPS coordinates
- Enterprise JavaBeans (EJB) - encapsulates business logic
- Hibernate ORM - object-relational mapping tool
- Stanford NLP - by The Stanford Natural Language Processing Group
- JavaServer Faces (JSF) - for building component-based user interfaces
- PrimeFaces - component library for JavaServer Faces (JSF) based applications